
If you had $3.5 million to donate, what cause would you support? Animals? The environment? Education? Culture? Your community?
How about all of the above? Over the holidays, that’s exactly what Portland did, give or take a couple thousand dollars. This year’s Willamette Week Give!Guide campaign was the biggest yet, and here are a few quick stats to prove it:
Yes, the scope and impact of WW’s annual fundraising effort have grown immensely since its inception in 2004. Back then, the Give!Guide raised $22,000 overall; these days, contributors match that amount in the space of ten minutes.
What Is The Willamette Week Give!Guide?
WW created the Give!Guide to provide its readers with a simple, surefire path to give back to local nonprofit organizations. Each year, the Guide gathers together over a hundred nonprofit participants whose missions fall into eight categories: Animals, Arts, Community, Education, Environment, Health & Wellness, Social Action, and Youth.
The Give!Guide differs from conventional year-end fundraising campaigns in a few key ways. First, it’s one of the only city-wide philanthropy initiatives we know of spearheaded by a weekly alternative newspaper. Second, G!G highlights the contributions of readers ages 35 and younger, in an ongoing effort to encourage more young people to make giving back a habit early in life. The newspaper also awards the Skidmore Prize to four local nonprofit leaders every year.
GB’s Role
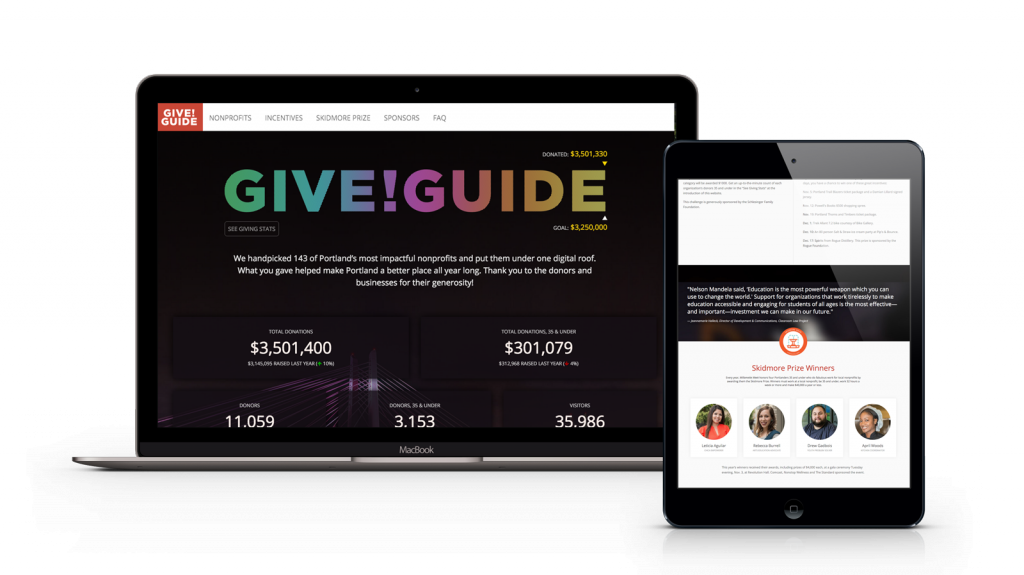
Grady Britton got involved with the Give!Guide a couple years ago when we acquired OakTree Digital. We rebuilt giveguide.org to provide some new functionality and a new look and feel. Because so many people donate using their phones—some sources claim more than half of nonprofit website visitors are using a mobile device—we knew we needed to make the site mobile-friendly. We also wanted to optimize it to reach an even larger portion of that younger audience.
Last year, we improved the site further, adding a bunch of security and transaction upgrades, such as reducing the possibility of accidental duplicate donations and allowing visitors to tell the site not to store their information. User experience-wise, we continued to streamline and spiff things up. It can be a challenge to feature all that data on one page—giving statistics, nonprofits and their categories, information about incentives, the Skidmore Prize winners, the list of sponsors, and frequently asked questions—but we think the site is sleeker, faster, and more usable than ever.
2015 G!G Results
But enough about us. Take a look at the outstanding results our city achieved last month:
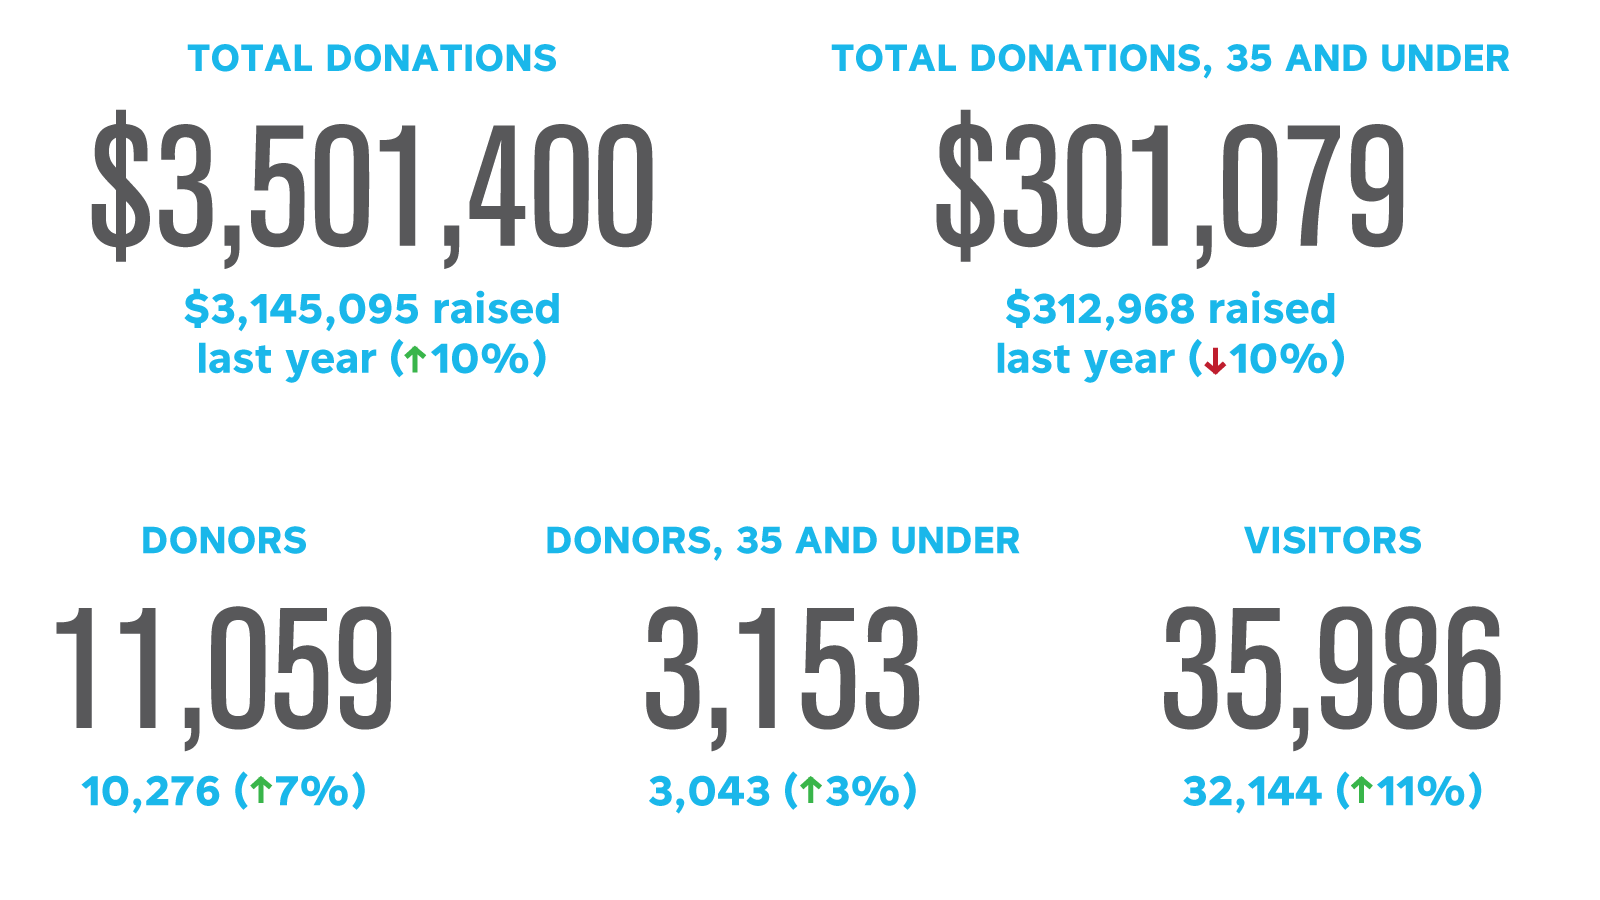
- Total donations: $3,501,400 (up 10% from 2014), $251,400 higher than the goal
- Total donations, 35 and younger: $301,079
- Website visitors: 35,986
- Total number of donations: 29,192
- Median donation: $50
- Average donation: $120
- Largest donation: $25,000
- Biggest giving day: December 31st ($825,622 raised from 4,983 in one day)
- Most active hour: 1pm (444 Donations)
- Biggest giving hour: 11am ($151,610)
- Visitor demographic breakdown by age:
- 18-24: 5.8%
- 25-34: 28%
- 35-44: 26%
- 45-54: 16%
- 55-64: 14%
- 65+: 9%
- Most raised for a single nonprofit: $171,084 (The Pongo Fund)
- Most organization popular among donors 35 and under: Planned Parenthood ($28,806 raised)
Thank you once again to everyone who made last year’s amazing results happen! We can’t wait to break the record once again in 2016.